Insights from Google`s PageSpeedRace
In the second quarter of 2018, I was still in the role of the Tech Lead at the Product Team at Stylight, one of our main OKRs was to improve the page load time on client/browser side. By accident we stumbled upon the Google PageSpeedRace a competition where companies would anonymously compete on improving their Lighthouse Score.
Every company had to hand in links for three page types: Home, Category and Landing. Then an initial average score was measured and the companies were grouped based on score ranges. The company with the highest difference between start and end score in their group won.
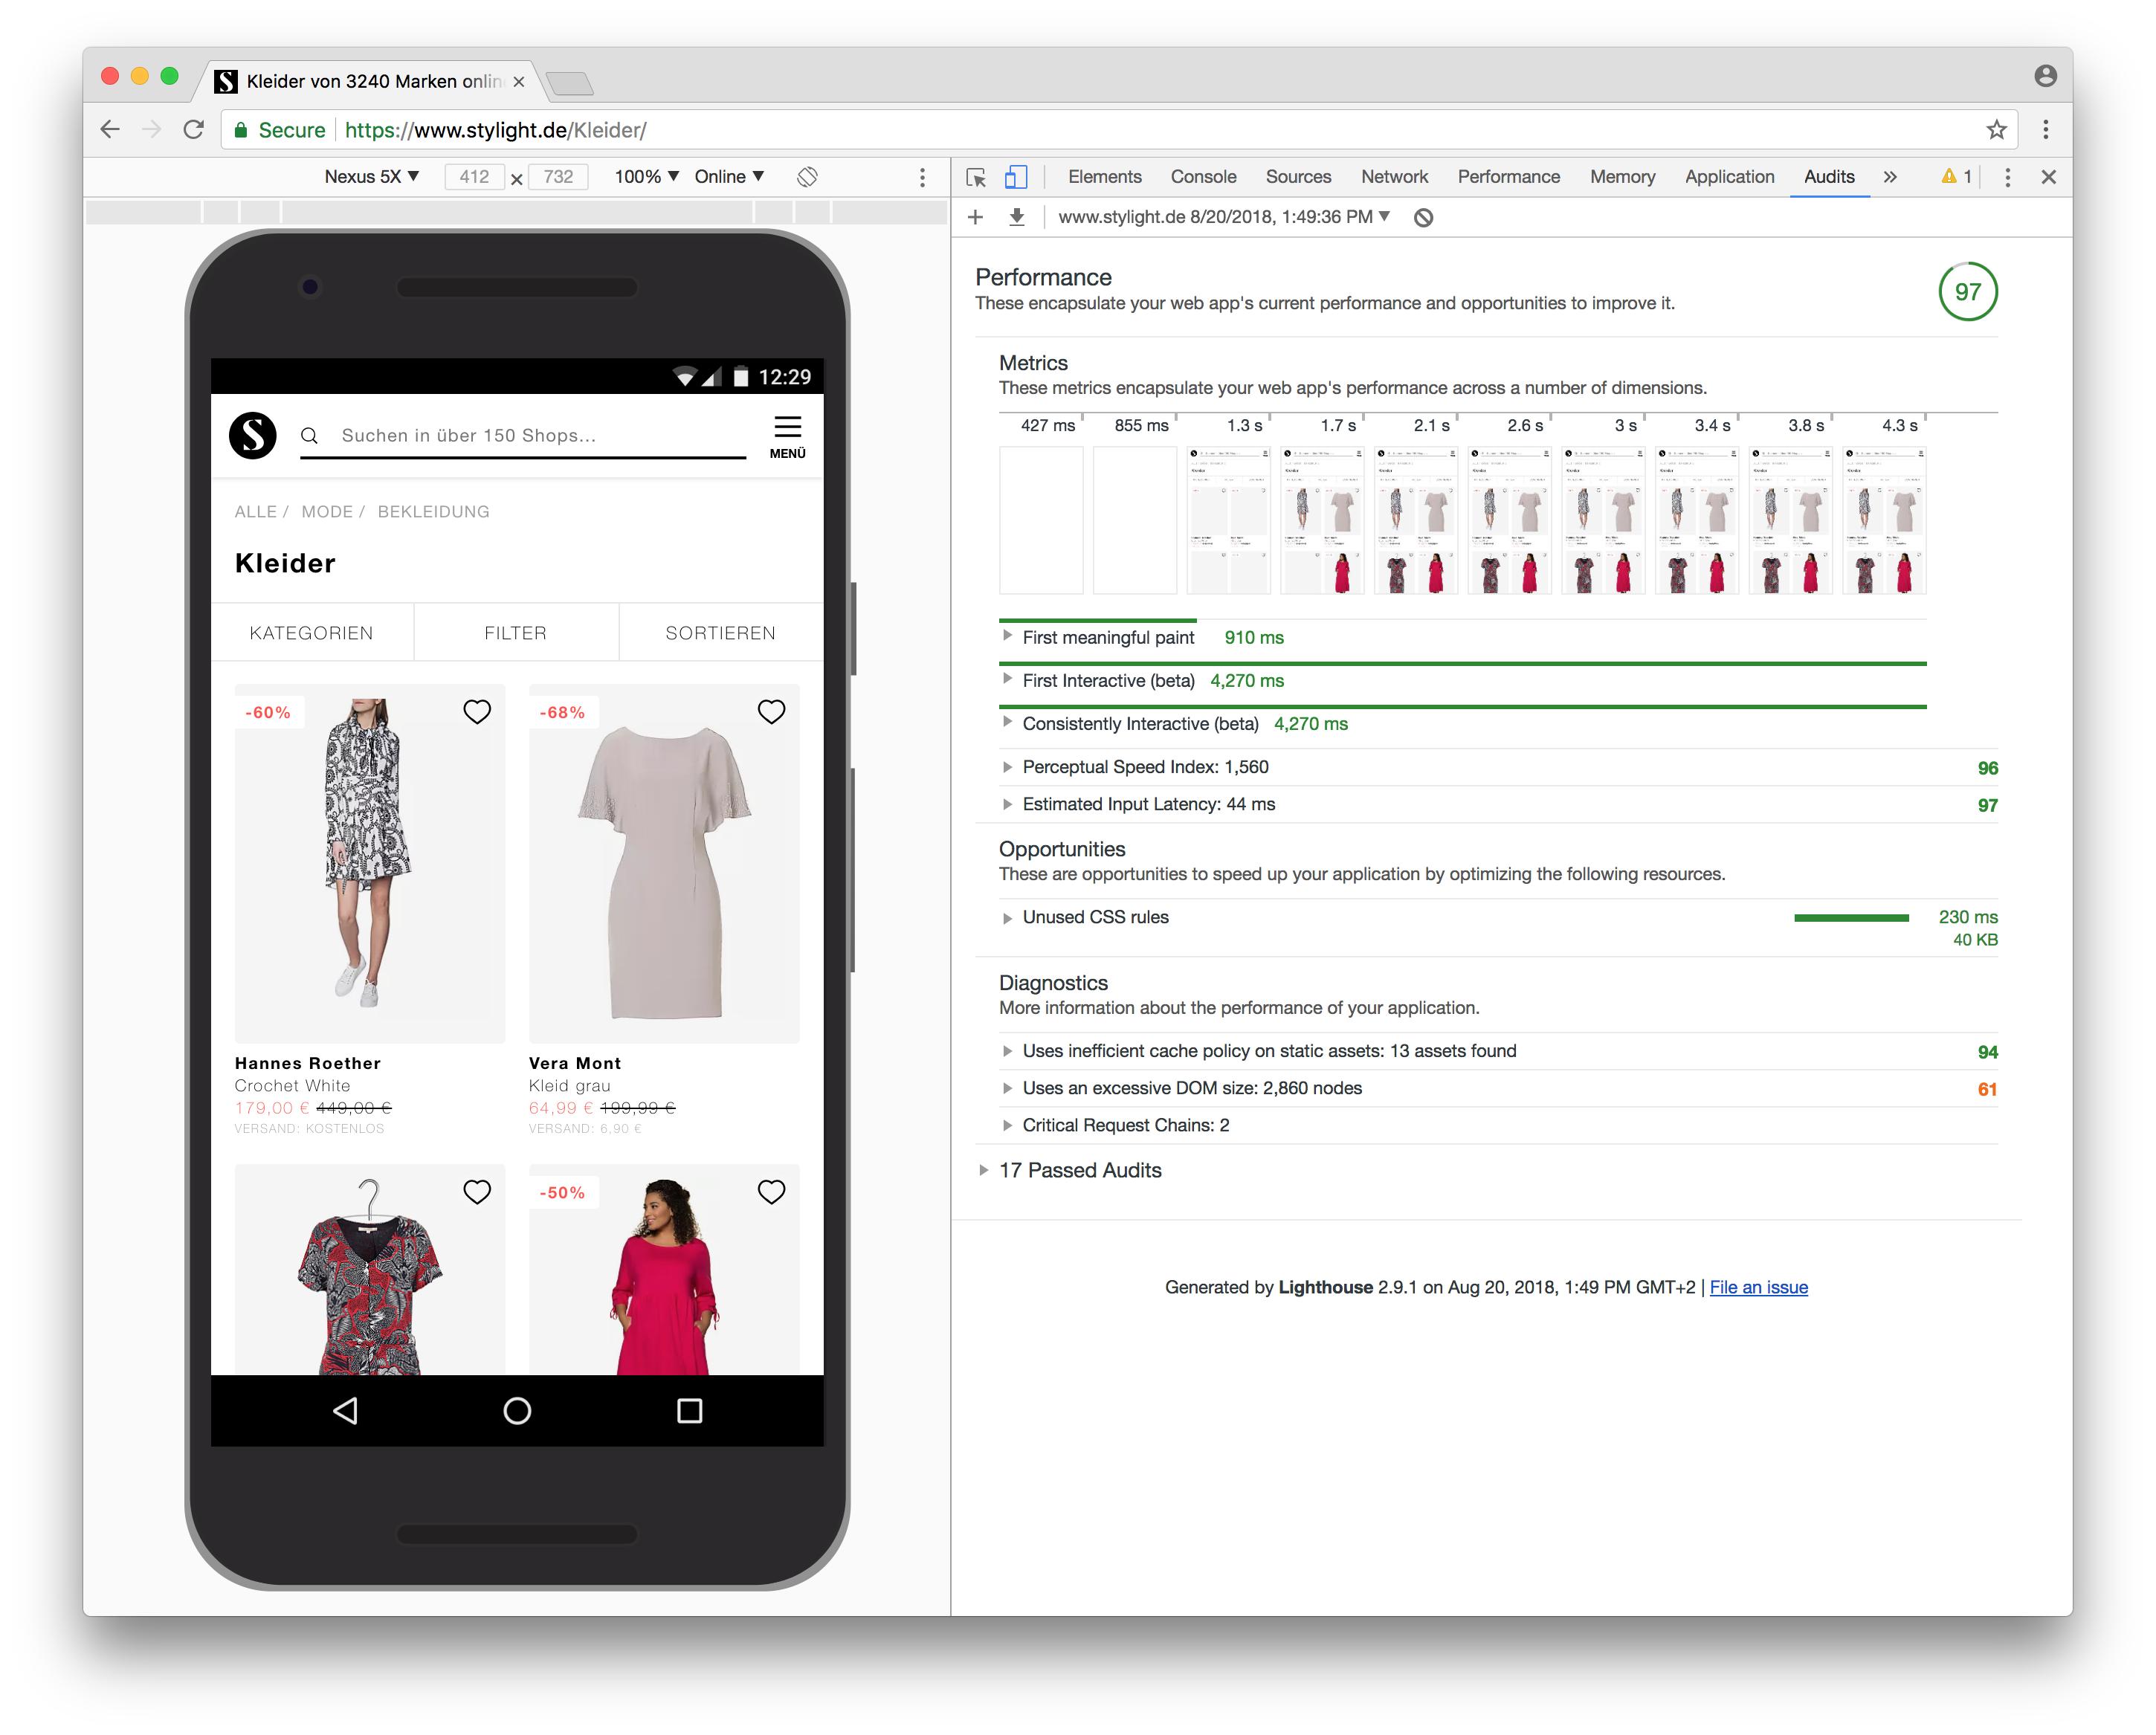
So I ended up spending the most time of this quarter analysing, measuring and optimising our HTML, CSS and Javascript structure and loading. This can get pretty frustrating but we managed to reach an average score of 97 out of 100 points (our starting score was around 48 points). We didn’t win though, because one company had a way lower initial value, so it was impossible to catch up on that.
My biggest takeaways are that there’s always stuff to improve and a lot of initial assumptions were proven wrong. As always in our business measuring and monitoring your performance is key and gamification can be a big motivational support. For more insight on how our KPIs improved by all the adaptations head over to the ThinkWithGoogle website where we published a case study (unfortunately in german).